rain city maps

Where's the Most Valuable Land in Seattle?

This map shows the estimated value of land (without buildings) in Seattle using an IDW interpolation of land value data from King County. As you might expect, downtown real estate is pretty valuable, while land is worth less farther North and South. Read more...
image of map

Did King County Trump Voters Vote Against an Increased Minimum Wage?

In the last election, Initiative 1433 gave Washington voters the chance to raise the statewide minimum wage to $13.50/hour by 2020. Voters also obviously had the opportunity to elect the next president. Here's a look at the relationship between the two at the precinct-level. Read more...
image of map

Live Traffic Cameras

Traffic is a big problem in Seattle. According to one estimate, traffic costs the average Seattle commuter $1,491 per year in wasted gas and lost productivity. This map can help you avoid some jams. It displays live images from traffic cameras from Seattle's Department of Transportation as well as a traffic overlay from Google. Read more...
image of map

Seattle Meals Programs

Every person deserves healthy food. This map shows the free meal programs for low-income and homeless people in Seattle. Click on the icons to see details for that meal, and select mealtimes using the box on the top right. Read more...
image of map

What Are Seattle's Top Uber Destinations?

This map shows the top destinations for Uber riders by neighborhoods from where the rides began. Mouse over the image to see a second map: a cartogram that distorts neighborhood size based on the proportion of Uber passengers starting from that neighborhood. Read more...
image of map

Which Restaurants Are Passing Health inspections?

The CDC estimates that every year 48 million people get sick and 3,000 are killed due to foodborne diseases. And, according to a study that took place in Seattle, restaurants with poor inspection results and violations of proper temperature controls were "between five and ten times more likely to have foodborne illness outbreaks." Read more...
image of map

Vaccination Rates at Public Elementaries

According to immunize.org, vaccines have saved more than a billion lives in the past 50 years. Meanwhile, kids in Seattle have lower polio vaccination rates than kids in developing countries. Here's a map showing vaccination rates by public elementary school. Read more...
image of map

Park Features Per Capita

Researchers have found that "parks with more features are more likely to be used for physical activity," and people who live near parks are likely to be more active and have healthier lifestyles. So, this is an attempt to look at how equitably parks are distributed throughout Seattle (by neighborhood). Read more...
image of map

Smith Tower in LiDAR

Did you know that Smith Tower--which was once the tallest building West of the Mississippi (and 4th tallest in the world)--has an apartment unit at the top? It looks amazing. Not to be outdone by the inside, here is an interactive look at how the exterior of the tower looks according to LiDAR. Read more...
image of map

Buildings with Affordable Rent in Seattle

Rent in Seattle is too damn high. Luckily, the city government currently has a program that gives tax breaks to apartment buildings that provide affordable housing for the middle class. If you make a middle-class wage you likely qualify. Read more...
image of map

SVG of logo.


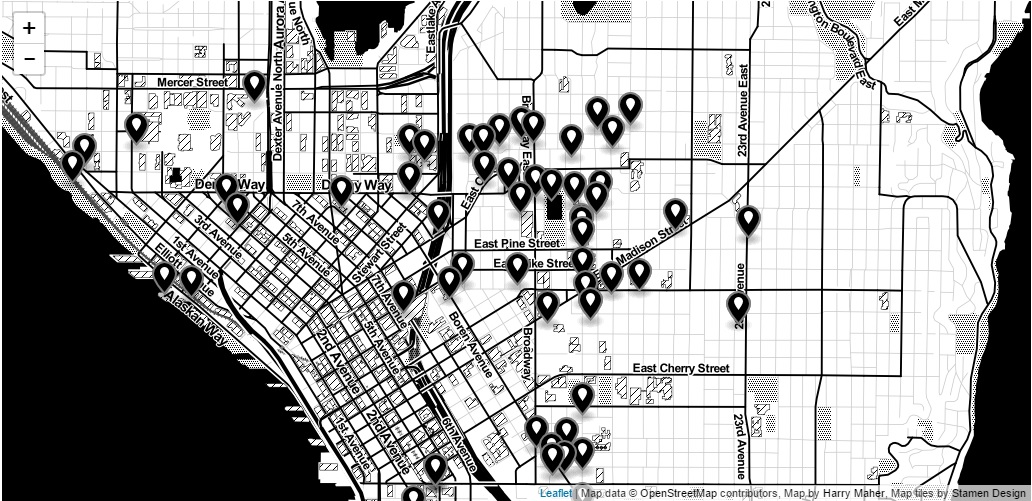
This site is composed of a collection of Seattle-related maps created with publicly available data by a recent transplant who wants to learn more about Seattle. New content will appear whenever I'm not too busy.

Please don't hesitate to with any questions. Enjoy!